Economic outlook scenarios

Just a few months ago, most experts predicted robust global economic growth for 2020. Now all of that has been thrown out the window, but the new predictions vary greatly. A closer look at optimistic, pessimistic and realistic scenarios.
In a nutshell
- A post-SARS scenario could see a quick economic bounce-back
- A Spanish flu-type scenario would mean a prolonged recession
- Current data suggest a U-shaped recovery
This report is part of a GIS series on the consequences of the COVID-19 coronavirus crisis. It looks beyond the short-term impact of the pandemic, instead examining the strategic geopolitical and economic effects that will inevitably be felt further in the future.
In January 2020, the International Monetary Fund was optimistic. It claimed that “[g]lobal growth is projected to rise from an estimated 2.9 percent in 2019 to 3.3 percent in 2020 and 3.4 percent for 2021.” That outlook, of course, has changed dramatically since.
Only three months later, various organizations predict that the world economy will grow at a dismal 0 to 1.5 percent in 2020. Can these numbers be trusted? The estimates are only as good as their underlying premises, and therein lies the problem. For all that we know today, it is difficult to make assumptions for two reasons. First, in times of crisis, there is a bias to assume crisis in all models. Second, there are many unknowns to be modeled. The chief unknowns are:
- Epidemiological issues: How does COVID-19 spread? How do infection rates change over time? How will immunization and inoculation procedures be established? Does the epidemiological spread follow a steady or a changing pattern, if at all? What are the effects of the various countermeasures taken by governments?
- Issues related to the economic structure: How does the loss of business affect companies and their supply chains? For how long will companies have enough liquidity to keep themselves in the market even if they lose business? For how long will companies have enough long-term capital to take up debt during the downturn? For how long will financial agents be able to provide liquidity and/or capital to affected firms? For how long will governments and their social-security systems be financed or financeable, so that they can sustain the countermeasures put in place?
- Issues related to the economic process: How deeply will economic activity be affected by the situation? How long will the restrictive measures imposed by governments remain in place? How will the exit strategies allow for resuming economic processes? Will consumers return to their pre-pandemic habits, including in tourism? Will companies rehire people or increase their staff? What will the impact be when the countermeasures imposed by governments must be paid for?
In times of crisis, there is a bias to assume crisis in all models.
The answers to these questions make up some of the input for prognostic models. Depending on the answers – the assumptions of the model – the outputs differ. Organizations that expect the global economy to grow at 0 percent in 2020 have more pessimistic assumptions; those estimating 1.5 percent economic expansion go with a more optimistic set. A scenario-based approach is more useful because it not only shows different possible outcomes but links assumptions to models and their outputs.
Optimistic scenario
This scenario has a probability of less than 20 percent. It is broadly based on how the outbreak of severe acute respiratory syndrome (SARS) was managed in 2003-2004. In the short term, there was a global spread with severe effects across the economy, including the financial sector. Still, in this short-term view, several countries’ gross domestic product (GDP) fell drastically, and some financial markets sank by 30 percent. However, six months after countermeasures ended, financial markets were back to their pre-outbreak levels. Economies took 10 months, at most, to recover.
Facts & figures
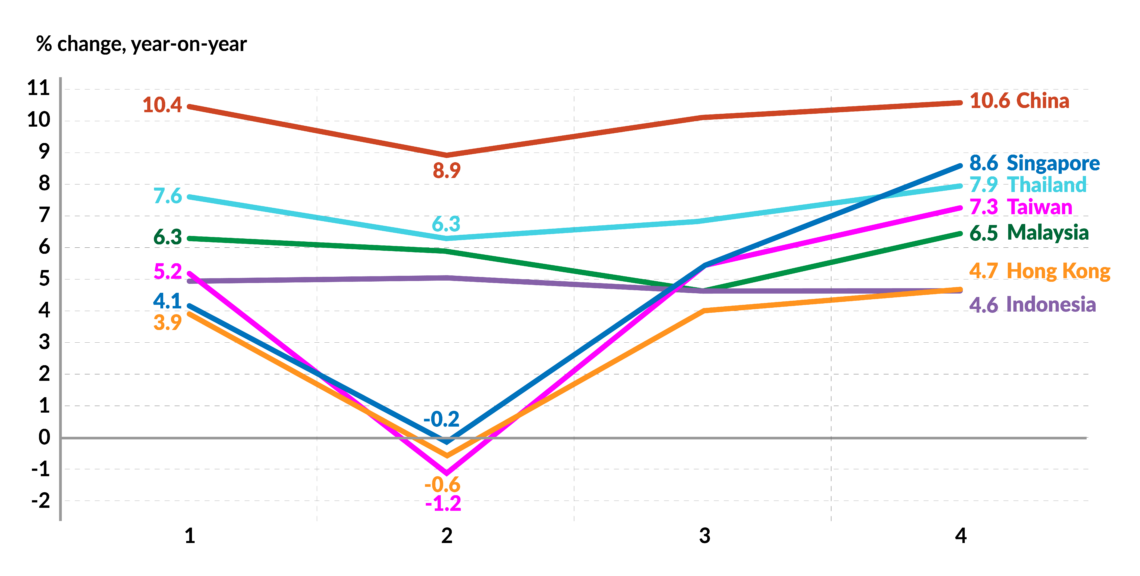
The optimistic scenario relies on a considerable increase of economic activity in Asia. This is underway, for example, in China, South Korea and Japan. It also foresees increased onshoring of supply chains in Europe and North America. Companies that want to make their supply chains more resilient will bring back – and digitize – some parts of the value chain. This, in turn, will unlock new investments and create jobs, which will further diffuse into the economy by stimulating demand.
The optimistic scenario foresees a global economic growth of 1.5 percent in 2020. Where COVID-19 has abated more quickly, like in Asia, economies might even grow by as much as 4 to 5 percent. Where the disease subsides more slowly – as in Europe – economies will shrink slightly, by around -0.8 percent. Even in this scenario, the more volatile region is North America, since the U.S. administration as at times indicated it could end countermeasures independent of epidemiological developments. There, the optimistic scenario still foresees 1 to 2 percent growth in 2020.
Pessimistic scenario
This scenario has a probability of about 30 percent and is based on the Spanish influenza of 1918-1920, when three waves of influenza hit. The second wave was much stronger than the first. Around a quarter of the world’s population was infected and as many as 100 million people died. Also, this scenario relies on the contagion patterns of the 2008-2009 financial crisis. It factors in economic problems beginning as a lack of liquidity and progressing to more severe structural breakdowns.
Another COVID-19 wave would further expose the structural economic problems that have accumulated in recent decades.
Under the pessimistic scenario, another COVID-19 wave would further expose the structural economic problems that have accumulated in recent decades. State-intervention and loose monetary policy have fueled a bubble that sustains companies living on a steady inflow of cash from financial markets but that do not add value to the economy or have stable capitalization to overcome times of distress. These companies cannot recover the jobs and capital they lose. Additionally, global supply chains are not resilient – interruptions can leave them permanently broken. The cost of making products will therefore rise. To absorb these increases, companies will digitize. Digitization leads to fewer jobs, hence rising unemployment and falling consumption.
Under this scenario, the global economy falls into an L-shaped recession in the second half of 2020, followed by a continued crisis lasting at least until the end of 2021. The forecast here is a global economic contraction of -1 to 0 percent in 2020. Due to developmental effects, growth in Asia should be around 3 percent; in Europe -3 to -2 percent, and in North America -1 percent. Governments will try to respond with stimulus, but this will contribute to larger levels of public debt.
Realistic scenario
This scenario has a probability of about 50 percent. It is based on the daily rate of infections as well as daily mortality. While the absolute number of infected people is still on the rise, the daily rate of new infections is slowing. Depending on the econometric model chosen, rates turn negative 60 days, at the latest, after countermeasures are implemented. This would mean that there are fewer new infections each day. This corresponds to Asian and European nations’ experiences; for the United States, however, these projections seem not to apply.
This scenario also relies on economic indicators such as energy futures, raw material purchases, changes in inventories, and so on. These indicators are on the rise, at least for Asia and North America, although not for Europe. It also expects that financial markets will price in the epidemiological and economic effects of COVID-19. This can be witnessed by the general decrease in daily volatility.
This scenario is more realistic than the other two because it is based on current patterns, not past events. It relies on recent data, especially those indicating future behavior. The probability that it will occur is therefore higher. Its results are not, however, a middle ground between the optimistic and the pessimistic. If these were each the ends of a continuum, the more realistic scenario would be placed nearer to the pessimistic than to the optimistic end.
Without a second wave of infections, there will be no full normalization before September 2020.
On a global level, this scenario foresees a U-shaped recovery. A similar pattern applies to China, Europe, and North America, with economic output falling between 10 and 20 percent in March to May, with growth appearing again in the second quarter. The output level of end-2019 is reached, at the earliest, by late 2020. It is more realistic, however, to expect output to reach December 2019 levels by mid-2021.
In Asia generally, the U shape does not necessarily mean recession for an entire year. China, Japan, Korea, Australia and New Zealand will face recessions in the first and second, possibly in the third quarter of 2020, but should report GDP growth in the last quarter. While the whole region could grow at 4 percent per year, China will reach 5 percent.
According to this scenario, the negative impact of COVID-19 is stronger in Europe, where partial or complete economic lockdowns are projected to last until May or even June. Without a second wave of infections, there will be no full normalization before September 2020. Under this scenario, fiscal and monetary countermeasures taken by different European nations will dampen supply and demand. Unemployment and higher private debt levels will reinforce this effect. In this scenario, Europe experiences a recession with -2 to -1.5 percent economic growth, measured annually.
As in the previous scenarios, North America has the most upside and downside potential. If the U.S. economic stimulus works and the countermeasures are lifted, North America can grow by about 1 to 2 percent. However, if COVID-19 spreads more quickly, affects more people and increases the mortality rate, a recession seems more probable, with a growth rate of -0.5 percent.
Age of volatility
These three scenarios show how widely prognoses can vary, especially in times like these. It is worth looking at them with caution, since as data change, so do models. The data are volatile, and therefore so are the economic prognoses.
Data volatility is the result of the flow of information on infection, mortality and immunization. Moreover, data change as epidemiological models improve. As the curves of infections in Europe and North America continue to climb, the data volatility is expected to remain high. Even the scenario-based approach for the economic outlook will need revisions.
The scenario-based approach is still useful. First, it shows how a prognosis is reached. Second, it opens the minds of economic agents to planning according to different outcomes. Third, it produces more reliable estimates.