A new era for natural gas markets

The LNG boom that followed Russia’s invasion of Ukraine is accelerating the transformation of global gas markets.
In a nutshell
- The 2022 energy crisis was less severe than expected
- LNG has allowed Europe to diversify supplies
- Global LNG competition is reshaping gas markets
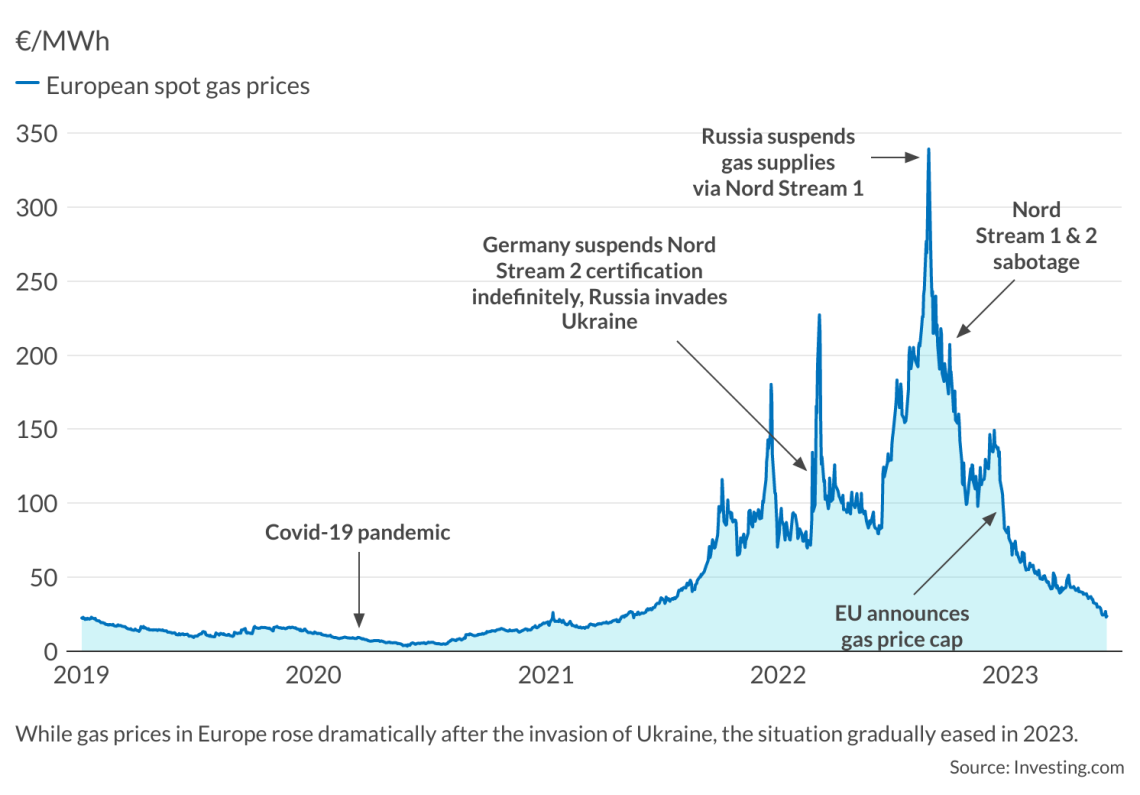
In 2022, Europe faced the harshest energy crisis in its modern history. Russia’s invasion of Ukraine drove gas prices to historic highs, with spot prices peaking at almost 340 euros per megawatt hour (MWh) on August 26, 2022 – an annual increase of more than 640 percent. One year later, however, prices have returned to their 2019-2021 average. By June 2023, they sat 92 percent lower than the 2022 peak, even though the conflict in Ukraine persisted and the majority of Russian pipeline gas supplies to the region have not been restored.
The risks have not entirely dissipated. However, such a swift return to normalcy postcrisis was unthinkable just a few years ago. A host of factors have contributed to this outcome, chief among them the growing flexibility of gas trade, particularly liquefied natural gas (LNG), which has expanded rapidly in recent years. From 2011 to 2021, interregional LNG trade grew more than four times as fast as pipeline trade. And in 2020, for the first time, the share of gas sold as LNG surpassed pipeline trade.
The growth of global LNG trade has significant implications for energy security, since it provides countries with access to a diverse range of natural gas supplies and helps to reduce dependence on a single source. Europe has directly benefited from this: when the Ukraine war began at the end of February 2022, it triggered a panic over potential gas shortages. By October, however, LNG tankers were lining up at European terminals.
While the worst of the crisis seems to be over, its impact will last for years to come, particularly on gas trade, main importing markets, and competition dynamics among the largest exporters.
Increasingly global gas markets
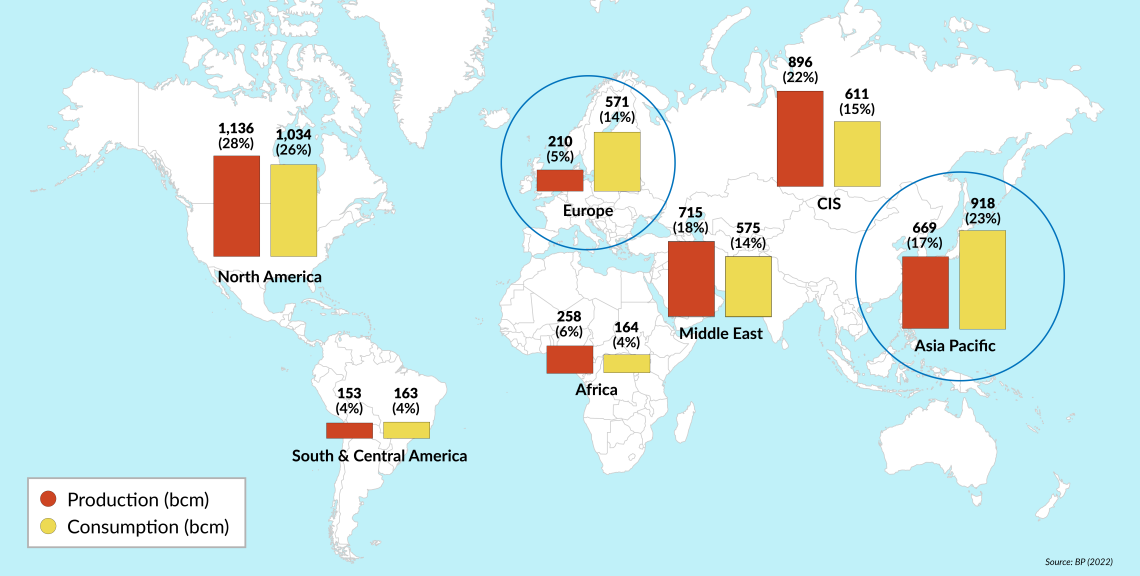
When it comes to global demand, North America is the leading market, accounting for around 26 percent, with the United States alone contributing 21 percent. Yet, unlike Asia Pacific – the second-largest market, accounting for 23 percent of global demand (including over 9 percent from China) – North America is a net exporter.
The other major net importing region is Europe. It is the world’s fifth-largest gas market in terms of gas consumption share (14 percent), but relies on imports for nearly 62 percent of its demand. South and Central America are also net importers but represent a minor market, contributing to only 4 percent of global demand. All other regions are net exporters.
In this context, Europe and Asia Pacific represent the most crucial markets for gas exporters. However, notable differences exist between the two. Asia Pacific is a rapidly growing gas market, largely due to the phasing out of coal, particularly in power generation. In contrast, Europe is a mature market that displayed only slow growth potential before the Ukraine war. Following the invasion and the fallout with its heretofore largest supplier, Russia, the European market is undergoing structural shifts in supply, opening the door to new exporters.
In 2021, 41 percent of the EU’s gas needs were met by Russian gas supplies, with Germany receiving half of those imports. By the end of 2022, that share dropped to less than 13 percent. The sizable supply gap resulting from Russia’s decision to halt most of its gas deliveries to Europe during the Ukraine war was mostly filled by LNG and Norwegian pipeline supplies.
Alternatives to replace Russian gas exports to the EU primarily include deliveries from Norway (mostly pipeline but also LNG) or North Africa. Azerbaijan also supplies gas to Southeast Europe and Italy. Of these alternative sources, LNG remains an indispensable supplement for the European Union to replace Russian gas at current levels of consumption. This is because pipeline deliveries from Norway, North Africa and Azerbaijan are constrained by production and/or pipeline capacity.
Russia’s energy export strategy
Even before the Ukraine conflict began, Russia was planning for a shift in the demand geography of its gas. With Asia emerging as a growth center and the European market stalling or shrinking, Russia aimed to diversify and expand its reach to minimize risks to its security of demand.
Central to this strategy was the expansion of LNG trade. A 2013 law allowed companies other than Gazprom, which has a monopoly over pipeline gas exports, and its subsidiaries, to export LNG. Notably, these companies are predominantly controlled or backed by the government.
Transitioning from pipeline to LNG exports offers Russia enhanced flexibility and potential optimization. By investing in LNG infrastructure, Russia can diversify its natural gas exports away from Europe, a market it has relied on for decades via a web of pipelines. With LNG, it can access new markets unconnected to existing pipeline infrastructure.
Facts & figures
Share of global gas production and consumption by region
Furthermore, LNG exports provide Russia with more flexibility in managing its natural gas supply and enable it to respond more swiftly to changes in demand. Since LNG can be transported by tanker to different parts of the world, Russia can adjust its exports based on changing market conditions. This gives it greater leverage in negotiations with gas-importing countries, increasing Russia’s importance and influence in global energy markets, particularly in Asia Pacific.
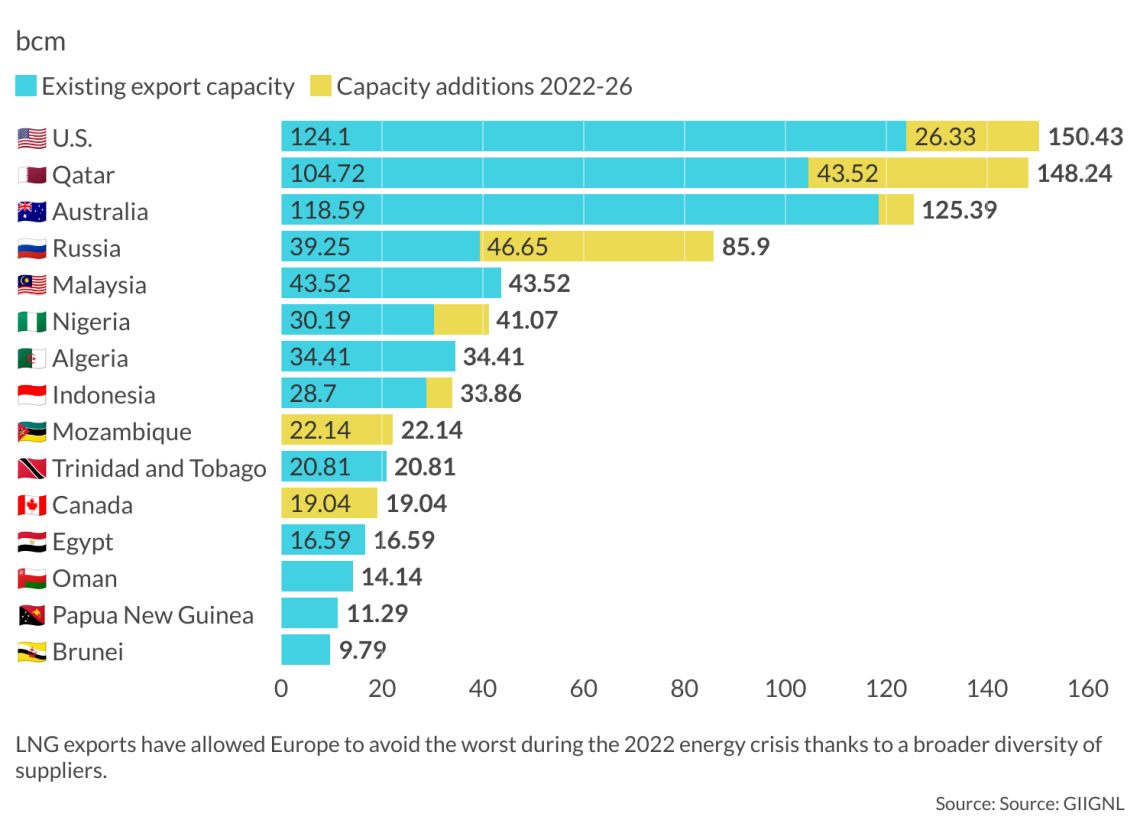
In 2021, Russia accounted for nearly 8 percent of global LNG trade, ranking fourth behind Australia (20.9 percent), Qatar (20.7 percent) and the U.S. (18.4 percent). While LNG exports were still small compared to Russia’s traditional pipeline business in 2021 (LNG exports were 17 percent of total exports of Russian gas), the largest addition in LNG capacity was expected from Russia by 2026. Those plans, however, are now jeopardized by sanctions, which limit access to the necessary technology and capital.
Competition between LNG exporters
The Ukraine conflict has created a major gas supply gap in Europe and simultaneously provided an opportunity for LNG exporters – particularly the big three of Australia, Qatar and the U.S., which account for 60 percent of global LNG trade. The fourth-largest LNG exporter, Russia, has less than half the market share of each of the top three exporters.
Europe has a well-established infrastructure for LNG receiving terminals, with more planned in response to the war, making it an attractive market for LNG exporters. The region is set to develop into a significant new LNG import destination.
Interestingly, while most of Russian pipeline gas supply to the EU was disrupted following the outbreak of war, LNG deliveries from Russia to the EU continued, even increasing by almost 22 percent in 2022 compared to 2021. However, Russia’s role in the European LNG market will depend on its ability to expand its LNG export capacity, the potential of sanctions on such trade, and the growing competition from other more powerful exporters.
The Big Three have significantly expanded their LNG export capability and competition is fierce among them. The Australian government best encapsulates the intensity of this competition: “The opportunity for Australia is huge, but so is the appetite of our competitors to snatch it from us.”
Australia, given its location, has focused on the Asia-Pacific region, unlike Qatar and the U.S., which have targeted a wider market reach. Based on reserve size and production cost, Qatar has a clear advantage over its closest competitors and is well-positioned to benefit from any growth in LNG demand in both Europe and Asia. Qatar typically sells its LNG under long-term contracts. The competitive advantage of American LNG includes not only geographic location, which allows the U.S. to competitively supply both the European and Asian markets, but also the flexibility of its LNG contractual arrangements, specifically destination flexibility, allowing buyers to divert cargoes to the most profitable LNG market.
In Europe, the competition is likely to intensify between Qatar and the U.S., which have been expanding their footprints in the market at the expense of Russian pipeline gas. Europe is currently Qatar’s second-largest market after the Asia-Pacific, though at a much smaller share. However, it could become a more significant market for Qatar’s LNG amid the ongoing geopolitical tensions. In November 2022, QatarEnergy, Qatar’s national energy company, signed two long-term agreements with ConocoPhillips to supply Germany with up to 2.72 billion cubic meters (bcm) of LNG from 2026, for 15 years, marking the first -ever long-term LNG supply to Germany.
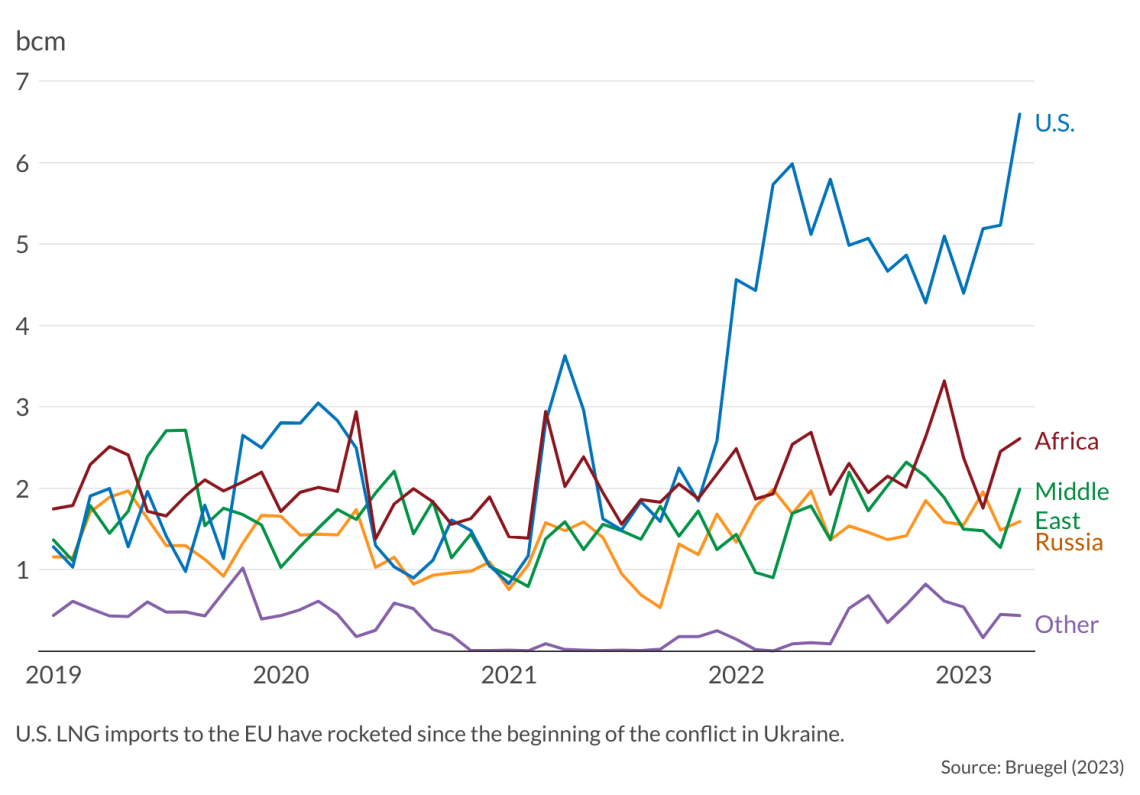
For the U.S., Europe is also an important market, ranking second after the Asia-Pacific, and accounting for 32 percent of total U.S. LNG exports in 2021. By April 2023, the U.S. provided 50 percent of the EU’s total LNG imports – exceeding supplies from the Middle East, Africa and Russia combined.
In the process, the increase in global export capacity and competition will likely cause the two crucial regional markets – Europe and Asia – to become ever more interconnected and prices more correlated.
Scenarios
For decades, Russia was Europe’s largest supplier, and Europe was Russia’s most important market. The severing of this relationship has had major implications for both parties, with Europe seeking alternative supplies and Russia looking for alternative buyers. However, both have been pursuing these objectives for years; the war in Ukraine has simply accelerated the process. Both parties found the primary solution in LNG, which offers consumers and producers flexibility that pipeline gas cannot provide.
The importance of LNG in globalizing international gas trade and linking production with consumption centers with limited access to pipeline gas is indisputable. LNG helps integrate regional gas markets into a global one. We are already witnessing the emergence of a key ingredient necessary to support the ever-increasing web of LNG cargoes connecting more remote supply and demand centers.
The war in Ukraine has highlighted the importance of LNG in enhancing supply security. A prime example is Germany’s decision to build its first LNG-import terminals in 2022.
In 2012, the International Energy Agency famously projected a golden age for gas. Following the war in Ukraine, the same agency argued that this long-awaited golden age was nearing its end before it even had a chance to fully materialize. However, the dynamics that have become more pronounced after the war indicate otherwise, at least for LNG, which is currently experiencing a golden period.
Facts & figures
Natural gas in 2023
- The EU accounts for 70% of the European gas market.
- Between 2011 and 2021, natural gas was the fastest-growing fossil fuel, with consumption rising by an annual average rate of 2.2% compared to 0.1% and 0.7% for crude oil and coal, respectively.
- Unlike oil, for which more than three-quarters of production is traded across regions in a global market, most of the gas produced is consumed locally.
- In May 2023, EU gas storage levels were 21% higher than those recorded in May 2022 and more than 18% above the 2011-21 average.
- China, a gas market of 379 bcm (just 4.5% smaller than the market of the whole of the EU in 2021), accounts for 41% of total regional demand.
- While natural gas accounts for 51% of Italy’s electricity mix, its share is less than 9% in Poland.

Sign up for our newsletter
Receive insights from our experts every week in your inbox.